Candle Pattern Builder/Profiler (CPBP) for TradingView

Candlestick/bar patterns have been around for a long time and are still very popular today. But not all patterns are created equal, and determining which patterns work well in the securities and timeframes of your choice is tedious to say the least. 

Well, now that is going to change! The Candle Pattern Builder/Profiler (CPBP) is a Pine Script toolkit that lets you define, visualize, and evaluate the performance of candlestick/bar patterns on TradingView charts...for any symbol and for any timeframe. 

Turn any pattern idea into a tested strategy with real metrics (Win%, PF, Expectancy, etc.) in minutes. 

CPBP combines a user-friendly and compact pattern language (similar to Pine Script), a real-time syntax checker, a library of popular built-in patterns, a large list of pre-coded patterns, and most importantly, a bar-by-bar analysis engine that tracks performance for every pattern you select (custom and/or built-in). This means that you can test the performance of patterns over thousands of bars in the securities and timeframes that you care about.

When you first load the indicator, nothing will be displayed. But the process to get it up and running is simple. Just type in one or more candle/bar patterns into the pattern editor (a syntax checker is provided to quickly track down any errors). 

We also provide a large number of pre-coded patterns that you can select from and simply copy and paste into the editor...you will find these near the end of the User Guide. You can use these pre-coded patterns as-is or modify them as you see fit.

Lastly, we provide 12 popular built-in patterns that you can select for analysis OR include as part of any custom pattern definition.

Once you have created and syntax-checked your custom pattern definition (or selected one or more of the built-in patterns) you can quickly test the performance of those patterns over thousands of bars of price data.

Using the Pattern Analysis module you will quickly see which patterns occur most frequently and which patterns are the most reliable/profitable. Also, patterns whose performance exceeds values that you define will be highlighted in the table.

The Pattern Analysis module turns each qualifying signal into an independent trade which starts at the next bar’s open. Stops are implemented using ATR-based distances and are recalculated on each bar. You can adjust the stop logic as needed via the provided Initial Stop and Trailing Stop menu options.

For each pattern that is tested, the following metrics are provided:

Trades, Wins, Win%, NetPts, PF, Exp/T, AvgBars, AvgMFE, AvgMAE, BestR, WorstR, AvgWin, AvgLoss, RR, LLS, and RollingPF.

You can also sort the table by any of the metrics in ascending or descending order. The highlight rules (set in the menu) will highlight any rows that meet your minimum Trades, PF, Win%, Exp/T, and RollingPF thresholds.

We have an extensive User Guide which you can view here, and you can find out more on the CPBP landing page. Currently, CPBP is only available for the TradingView platform and you can request a 14-day trial by sending your TradingView profile name to support@sr-analyst.com.

For those of you using the HPC Lite for TradingView system, this is a no-brainer. For the securities and timeframes you are interested in, just run CPBP first to see which patterns (custom and/or built-ins) are performing well and, going forward, use those as confirmation signals for the HPC patterns. 

Request your 14-day trial today! We are confident that if you try it, you will want to buy it!

Divergence Software, Inc. 
www.sr-analyst.com 
support@sr-analyst.com
 
Contact Us/Subscribe

Harmonic Pattern Collection Lifetime Package


If you are currently a Harmonic Pattern Collection monthly subscriber, consider upgrading to outright purchase of the Harmonic Pattern Collection. As a lifetime member you will receive:
  • TWO lifetime HPC software licenses. So you can install HPC on any two of the platforms that we support (i.e., eSignal, MT4, MT5, Ninja7, Ninja8, Sierra Chart, and TradingView).
  • Preferred access to HPC for any new platforms that we support in the future.
  • Access to a 3-month HarmonicTrader.com GOLD Membership, which has numerous educational resources and three LIVE sessions a week.
  • Access to study the HarmonicTrader.com GOLD Member educational Webinars (over 20 hours of material).
  • Priority technical/pattern support.
  • Receive PDF copies of ALL of Scott Carney's books:
    • "The Harmonic Trader"
    • "Harmonic Trading: Volume One"
    • "Harmonic Trading: Volume Two"
    • "Harmonic Trading: Volume Three"

Use Discount Code HPC10 at checkout for an additional 10% discount!


Divergence Software, Inc.
www.sr-analyst.com
support@sr-analyst.com
Contact Us/Subscribe

Spring Sale - 2020

Indicators for TradingView

You can view the full list of the indicators we have available for TradingView here.

Until April 30, 2020 if you purchase any two (or more) TradingView indicators you will receive an automatic 15% discount at checkout. Note: This discount applies to all TradingView indicators except HPC Lite for TradingView. See below for more information on that specific product.

HPC Lite for TradingView

We also recently released our HPC Lite for TradingView product. It is available for a one-time cost which includes all future updates, as well as access to Scott Carney's Harmonic Pattern Course, plus a few other goodies.

For more information on our HPC Lite product, please visit the landing page.

If you are interested in purchasing a license, use code HPCTV10 at checkout for a 10% discount. This offer will be active through April 30, 2020.

eSignal

Lastly, all of our eSignal indicators and systems are available for a 20% discount until April 30, 2020. Use code SPRING2020 at checkout.

You can view all of our products for eSignal on our Products page.

In addition, subscribe to our mailing list using the form at the bottom of our Contacts page and receive a one-time 20% discount code that you can use towards the purchase of any non-subscription product in our catalog.

Divergence Software, Inc.
www.sr-analyst.com
support@sr-analyst.com
Contact Us/Subscribe

Multi-TimeFrame Support/Resistance for TradingView

Tracking support/resistance levels from higher timeframes can be a tedious and time-consuming task, but in trading, it is critical to know where those levels are. Our new Multi-Timeframe Support/Resistance indicator for TradingView automates this process for you so you can focus on your trading.

By default, the indicator will automatically determine the higher timeframe to monitor based on the chart timeframe. So if you load only one copy of the indicator you can change your chart timeframe at any time and the MTF Support/Resistance will update automatically.

You can also load multiple copies of MTF Support/Resistance and each can be set to monitor a different higher timeframe. In the snapshot at the top of this page we have loaded 3 copies into the BitCoin chart to monitor the Daily, Weekly, and Monthly timeframes. As you can see in the snapshot, you can adjust the cosmetic properties for each copy to make it clear which timeframe the level is coming from.


The s/r levels themselves are based on swings in the higher timeframe price data, and you can adjust the strength of these swings in the indicator settings dialog. You can also adjust the proximity threshold in the event there are multiple levels in the same general vicinity in the timeframe being monitored.

And, as mentioned above, you have full control over the cosmetics. For each copy of the indicator that is loaded, you can set the line style, thickness, length, and color. The labels can be positioned either to the left or the right of the line, or turned off altogether. For the label content you can select to display just the price, just the timeframe, or both.

All in all, MTF Support/Resistance is an extremely useful indicator and it should be part of your TradingView toolbox.

The indicator is available on our Products page...just select the TradingView category in the indicator section.

Divergence Software, Inc.
www.sr-analyst.com
support@sr-analyst.com
Contact Us/Subscribe

S/R Trendlines for TradingView

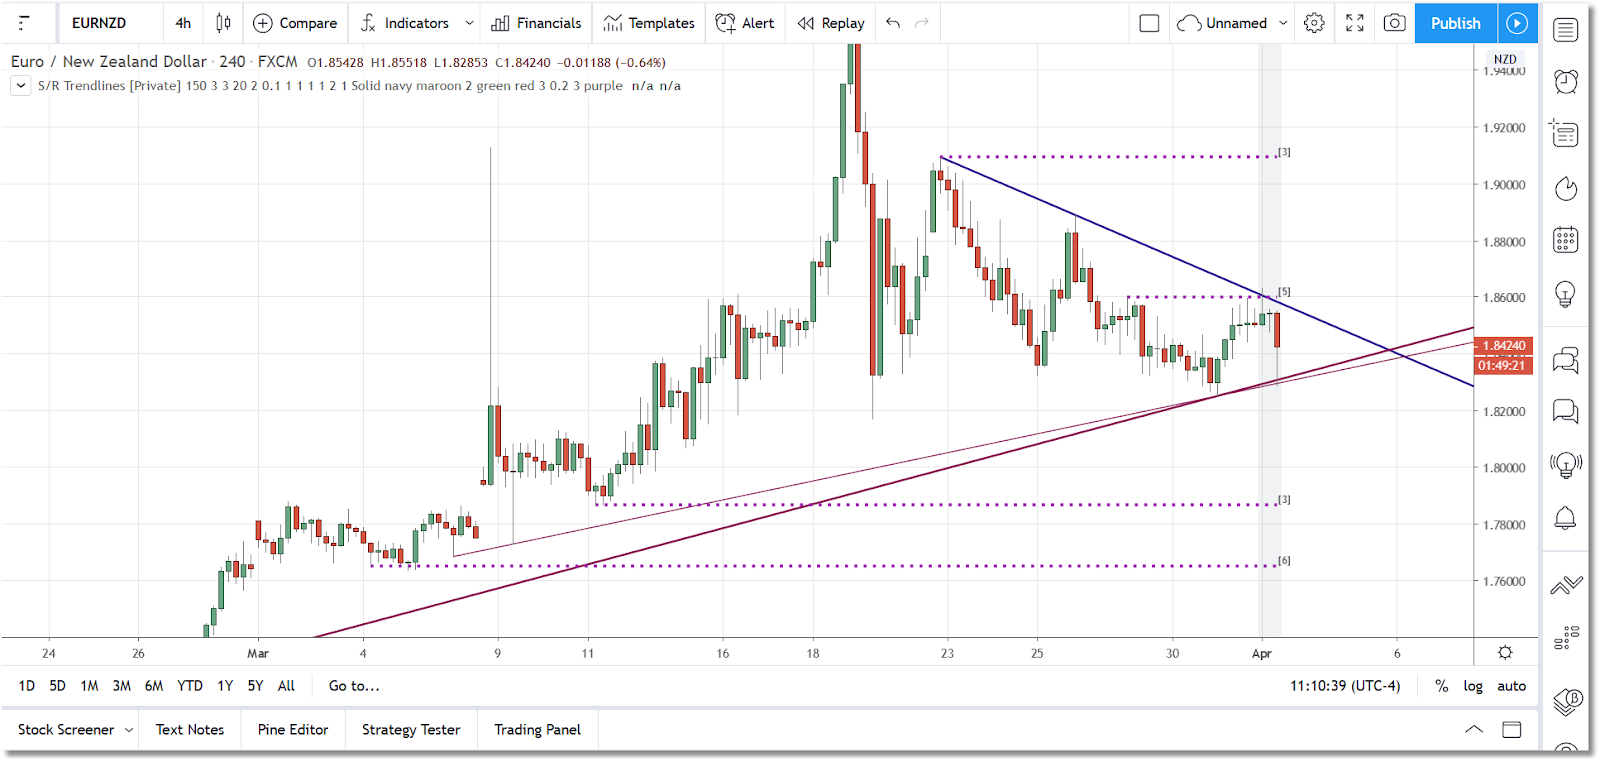
We are pleased to introduce a TradingView adaptation of our flagship S/R Analyst Pro product in the form of a new indicator called S/R Trendlines. It is the ultimate tool for the trader or investor who wants to fully exploit the power of support/resistance and trendlines in his or her trading.

Using a set of rules and user-defined weightings it mathematically identifies, draws, and updates the best trend lines (up to 3 upper trendlines and up to 3 lower trendlines) based on recent price action. It also automatically identifies and draws the two most recent gap zones in the vicinity of current price as well as up to four of the strongest s/r (support/resistance) levels found in the price action.

Highlighting open gaps just above current resistance.

A side benefit is that the combination of trend lines and s/r lines that it produces also tend to highlight a number of important price patterns, such as double tops and bottoms, triangles, flags, pennants, and wedges.

S/R Trendlines uses the concept of an 'Ignore Zone' which, by default, is comprised of the most recent 3 price bars and is shaded in light grey. Trendline or s/r level breaks that occur in the Ignore Zone do not invalidate the trendline or the s/r level. Thus you can see the breakouts as they occur and make your trading decisions before the invalidated trendlines or s/r levels are removed from the chart.

Support/resistance levels displayed as dashed lines.

With a large number of settings that can be adjusted by the user, S/R Trendlines can be customized to a high degree, and it is very easy to use and understand... even for beginners.

The indicator itself is available on our Products page...just select the TradingView category in the indicator section.


Divergence Software, Inc.
www.sr-analyst.com
support@sr-analyst.com
Contact Us/Subscribe

Triangle Pattern for TradingView


Finding a relatively safe, simple, and reliable mechanism to trade the markets day in and day out is not easy. There are a lot of "black-box" systems out there that claim good results, but with a closed system you never fully understand how it works and under what conditions it might fail. Also, in that environment you will never actually learn how to trade by making your own decisions.

One of the first books recommended to me when I first became interested in trading/investing was Technical Analysis of Stock Trends by Edwards and Magee, and it is one of the few that I still refer to today. While the examples in the book are quite old, the methodology outlined in the book (specifically with regard to support and resistance and trading price patterns) still holds true in the modern markets.

Price patterns, such as the triangle, are well documented, they occur frequently in all securities and time frames, and are relatively easy to trade for newbies and veterans alike. They are particularly prevalent in the Forex market which, of course, is quite popular at the moment.

The triangle is a consolidation pattern and it can occur at any time. The best triangles, though, are those that occur during a strong trend (bullish or bearish). After a strong move the market will take a breather and consolidate for a period of time before resuming the previous trend. This consolidation often takes the form of the Triangle pattern which is a series of diminishing coils typically with diminishing volume.

As the price action nears the apex of the triangle a breakout will occur on higher volume. The breakout is expected to be in the direction of the prior trend, the price target is the breakout point plus the overall height of the triangle, and the stop is typically placed at the most recent swing low/swing high just prior to the breakout. If you scan through charts for almost any symbol, and on any bar interval, you will see this happen over and over again.

The Triangle Pattern for TradingView indicator automates the triangle identification process. It looks for price action that typically indicates the beginning of a triangle formation, and it draws an outline giving you an idea as to the height and the length of the pattern (it will also trigger a TradingView alert). Not all patterns found by the indicator will develop into actionable triangles, but a good number of them will. And as long as you follow a few basic rules (outlined in the User Guide) you can generate a good number of trades per day just by monitoring a small basket of symbols/intervals.

More information is available in the User Guide. The indicator itself is available on our Products page...just select the TradingView category in the indicator section.

Divergence Software, Inc.
www.sr-analyst.com
support@sr-analyst.com
Contact Us/Subscribe

HPC Lite for TradingView

TradingView (www.tradingview.com) is rapidly becoming the most widely used online financial platform, and for years it has been one of the most requested platforms for our Harmonic Pattern Collection (HPC) product. Until recently, though, it was not possible to port our HPC product to the TradingView platform due to limitations in their PineScript language.

In June of last year TradingView made some significant changes/upgrades to the language and we set out to develop a version of HPC that would work in the TradingView online and mobile environment.

The result is HPC Lite for TradingView. It consists of 5 indicators...one to identify and draw all MW patterns (e.g., Crab, Bat, Gartley, etc.), another to identify and draw all Shark and ABCD patterns, and the remaining three indicators to plot the HSI, HSI Arrows, and ampRSI which are the primary supporting indicators for the HPC product.

We call it "HPC Lite" because there are still some code-size, code-complexity, and overall functionality restrictions in PineScript that prevent us from implementing all of the features that we have in our desktop HPC versions. That said, it is still an impressive product that does a great job in identifying recent tradeable patterns, and it will all run in the TradingView mobile app as well as their online charting platform.

The HPC Lite for TradingView product is part of our HPC Collection and we currently have versions available for eSignal, NinjaTrader, MetaTrader, Sierra Chart, TradingView, and Thinkorswim.

For more information please visit the HPC Lite for TradingView landing page.

Divergence Software, Inc.
www.sr-analyst.com
support@sr-analyst.com
Contact Us/Subscribe
Harmonic Pattern Collection for MetaTrader 4


We are pleased to announce the release of our Harmonic Pattern Collection for MetaTrader 4. MT4 is by far the most popular currency trading platform on the market with a user base that spans the globe.

The biggest issue we had with the MT4 implementation is the fact that the platform has no built-in scanner or watchlist functionality....it is strictly chart-based. So we had to design and build our own from scratch.

The result is an extremely powerful and flexible product that has features not typically seen in an MT4 offering. Various templates are provided that make it quick and easy to load the core HPC indicators into any chart. We also have a number of "how-to" videos to get you up and running quickly as well as a very detailed User Guide.

The scanning/monitoring functionality is exceptional. You can load multiple scanners (each in a different timeframe) and each scanner can accommodate up to 50 symbols. The scanners themselves are standalone windows that can be placed anywhere on your desktop, which comes in handy if you have a multi-monitor trading rig.

A chart-linking feature has also been implemented. Basically you select one of your MT4 charts to be the link recipient and, thereafter, any time you double-click on a row in any of your scanners, the link chart will change to the symbol and timeframe specified by the scanner.

Alerts have also been added to both the scanner module as well as the chart-based indicators.

The Harmonic Pattern Collection for MT4 is part of our HPC Collection and we currently have versions for the eSignal, NinjaTrader, Sierra Chart, MT4, and ChartIQ platforms.

For more information please visit the HPC landing page and review the User Guide.

Divergence Software, Inc.
www.sr-analyst.com
support@sr-analyst.com
Contact Us/Subscribe

Harmonic Pattern Collection for Sierra Charts

 We are excited to announce the upcoming release of our Harmonic Pattern Collection for Sierra Charts. Sierra is a full-featured charting/trading platform second to none. For more information on the Sierra platform go here.

The product is pretty much identical in functionality to our Harmonic Pattern Collection for eSignal. Sierra Charts offers a Study Summary which is very close in functionality to the eSignal watchlist feature.

The full complement of HPC studies has been integrated, including the pattern scanner, HSI indicator, HSI Arrows, RSI Bamm, Amplified RSI and Pi Phi Bands.

HPC for Sierra Charts will initially be available for the 64-bit Sierra platform. 32-bit support will be added down the road.

We are looking for a handful of Sierra Chart users to do some product stress testing/beta testing. If you are interested, please send us an email at the address below.


Divergence Software, Inc.

www.sr-analyst.com
support@sr-analyst.com
Contact Us/Subscribe

HKD - Bearish Bat

HKD (Hong Kong Dollar). A very nice bearish Alt-Bat just reaching it's final price targets on the 5-min chart after we were alerted in early afternoon.


Divergence Software, Inc.
www.sr-analyst.com
support@sr-analyst.com
Contact Us/Subscribe

GBP - Consolidation

GBP (US/British Pound) winding into some tight consolidation on the 5-min chart, and is forming a tight pennant on the 120-min on declining volume.


Divergence Software, Inc.
www.sr-analyst.com
support@sr-analyst.com
Contact Us/Subscribe

AUDNZD - Bullish Bat

Bullish Bat forming on the AUDNZD (Aussie/New Zealand) daily chart, and price beginning to move out of the PRZ.


Divergence Software, Inc.
www.sr-analyst.com
support@sr-analyst.com
Contact Us/Subscribe

NZD - Retest of Highs

NZD (New Zealand Dollar) is retesting highs around the 0.7440 level on the daily chart.

If it can break 0.7450 then next logical target would be 0.7558, last seen back in late July 2017.


Divergence Software, Inc.
www.sr-analyst.com
support@sr-analyst.com
Contact Us/Subscribe

EURAUD - Bearish Crab

Bearish Crab completing on the EURAUD weekly chart.

This coincides with a retest of recent resistance on the daily chart where we actually have some consolidation in the form of a bullish flag formation, so there may be more upside to come. Worth keeping an eye on.


Divergence Software, Inc.
www.sr-analyst.com
support@sr-analyst.com
Contact Us/Subscribe

EURCAD - Possible Breakout on 240Min

Possible breakout from recent resistance coming on the EURCAD 240-min chart. Next stop would be 1.5914 which was touched back in February 2016.


Divergence Software, Inc.
www.sr-analyst.com
support@sr-analyst.com
Contact Us/Subscribe

Product Spotlight - Harmonic Pattern Collection

A major update to our Harmonic Pattern Collection for eSignal product has just been released and is available for download!

ES - Poised for a Breakout

The SP Emini looks like it may break out of recent consolidation on the 240-min chart. Watching for a move above 2809.50 on volume.

Divergence Software, Inc.
www.sr-analyst.com
support@sr-analyst.com
Contact Us/Subscribe

CAD - At Recent Support

CAD (Canadian Dollar) touching support on the 240-min chart.

If it fails then next move is likely to be 1.23552, which was the low made on 01/05/2018.

If it bounces then this could be the beginning of the next leg up as we currently have a higher-high and a higher-low in place.

Divergence Software, Inc.
www.sr-analyst.com
support@sr-analyst.com
Contact Us/Subscribe

EUR - Breakout above Recent Highs

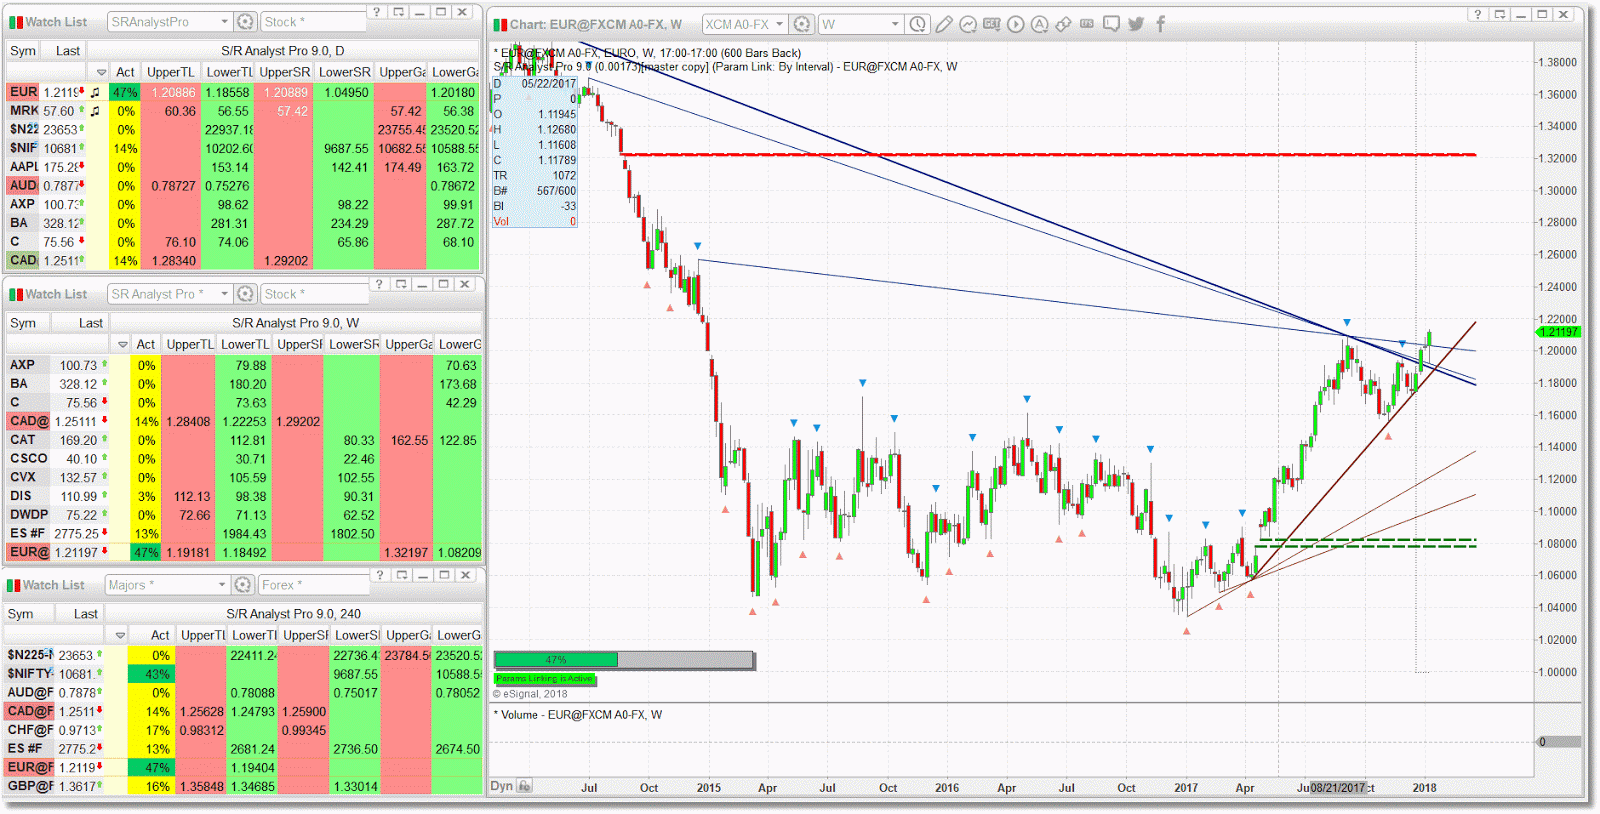
Euro Weekly
EUR (Euro) breaking out above recent highs this morning.

At 1.2123 now, should see at least 1.2350. See our original post on 01/04.


Divergence Software, Inc.
www.sr-analyst.com
support@sr-analyst.com
Contact Us/Subscribe

Latest Post

Candle Pattern Builder/Profiler (CPBP) for TradingView

Candlestick/bar patterns have been around for a long time and are still very popular today. But not all patterns are created equal, and dete...

Most Popular