Showing posts with label SRPro. Show all posts

S/R Trendlines for TradingView

We are pleased to introduce a TradingView adaptation of our flagship S/R Analyst Pro product in the form of a new indicator called S/R Trendlines. It is the ultimate tool for the trader or investor who wants to fully exploit the power of support/resistance and trendlines in his or her trading.

Using a set of rules and user-defined weightings it mathematically identifies, draws, and updates the best trend lines (up to 3 upper trendlines and up to 3 lower trendlines) based on recent price action. It also automatically identifies and draws the two most recent gap zones in the vicinity of current price as well as up to four of the strongest s/r (support/resistance) levels found in the price action.

Highlighting open gaps just above current resistance.

A side benefit is that the combination of trend lines and s/r lines that it produces also tend to highlight a number of important price patterns, such as double tops and bottoms, triangles, flags, pennants, and wedges.

S/R Trendlines uses the concept of an 'Ignore Zone' which, by default, is comprised of the most recent 3 price bars and is shaded in light grey. Trendline or s/r level breaks that occur in the Ignore Zone do not invalidate the trendline or the s/r level. Thus you can see the breakouts as they occur and make your trading decisions before the invalidated trendlines or s/r levels are removed from the chart.

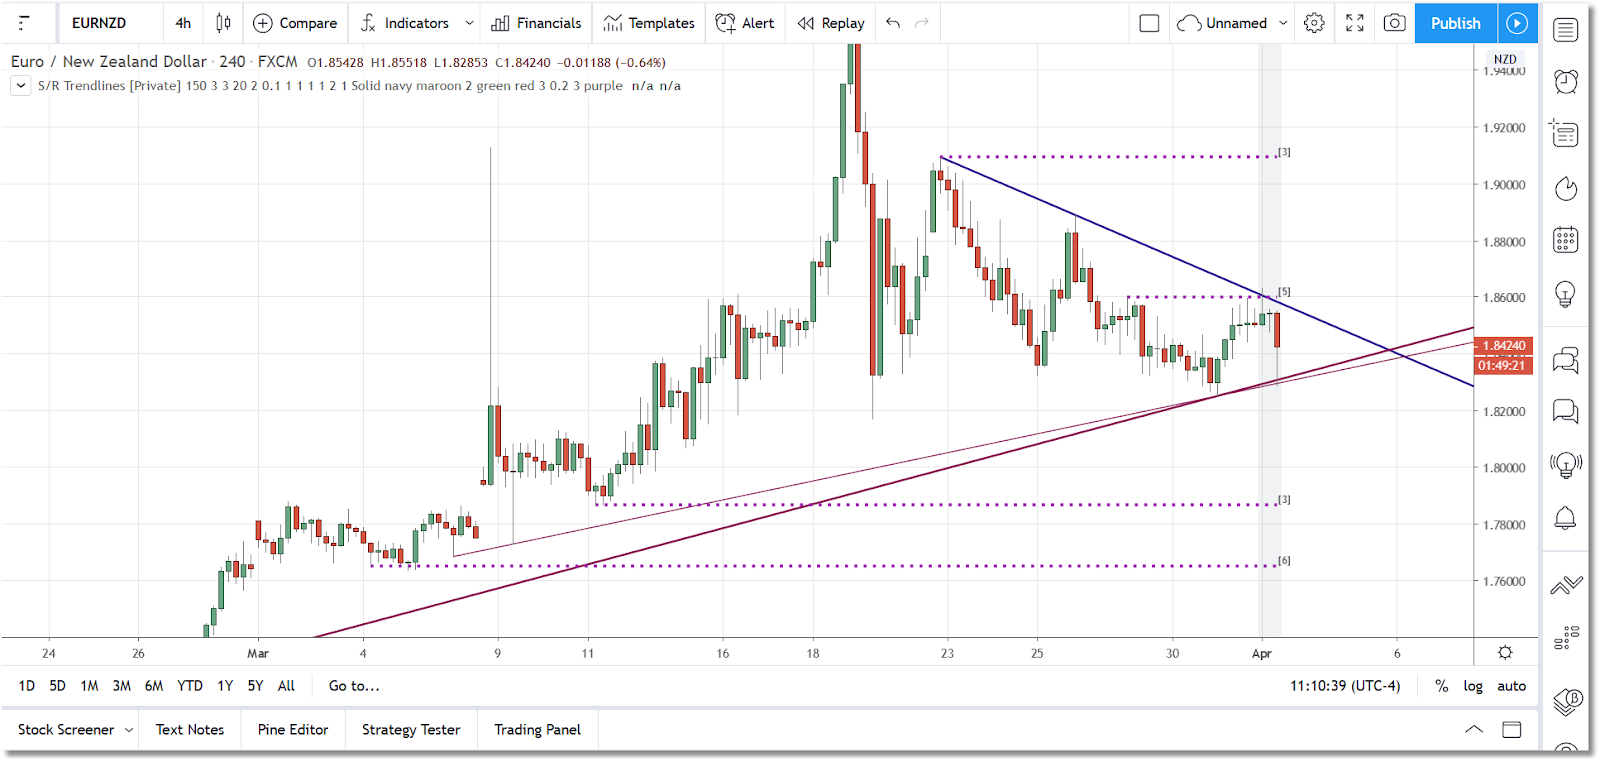
Support/resistance levels displayed as dashed lines.

With a large number of settings that can be adjusted by the user, S/R Trendlines can be customized to a high degree, and it is very easy to use and understand... even for beginners.

The indicator itself is available on our Products page...just select the TradingView category in the indicator section.


Divergence Software, Inc.
www.sr-analyst.com
support@sr-analyst.com
Contact Us/Subscribe

GBP - Consolidation

GBP (US/British Pound) winding into some tight consolidation on the 5-min chart, and is forming a tight pennant on the 120-min on declining volume.


Divergence Software, Inc.
www.sr-analyst.com
support@sr-analyst.com
Contact Us/Subscribe

NZD - Retest of Highs

NZD (New Zealand Dollar) is retesting highs around the 0.7440 level on the daily chart.

If it can break 0.7450 then next logical target would be 0.7558, last seen back in late July 2017.


Divergence Software, Inc.
www.sr-analyst.com
support@sr-analyst.com
Contact Us/Subscribe

EURCAD - Possible Breakout on 240Min

Possible breakout from recent resistance coming on the EURCAD 240-min chart. Next stop would be 1.5914 which was touched back in February 2016.


Divergence Software, Inc.
www.sr-analyst.com
support@sr-analyst.com
Contact Us/Subscribe

ES - Poised for a Breakout

The SP Emini looks like it may break out of recent consolidation on the 240-min chart. Watching for a move above 2809.50 on volume.

Divergence Software, Inc.
www.sr-analyst.com
support@sr-analyst.com
Contact Us/Subscribe

CAD - At Recent Support

CAD (Canadian Dollar) touching support on the 240-min chart.

If it fails then next move is likely to be 1.23552, which was the low made on 01/05/2018.

If it bounces then this could be the beginning of the next leg up as we currently have a higher-high and a higher-low in place.

Divergence Software, Inc.
www.sr-analyst.com
support@sr-analyst.com
Contact Us/Subscribe

EUR - Breakout above Recent Highs

Euro Weekly
EUR (Euro) breaking out above recent highs this morning.

At 1.2123 now, should see at least 1.2350. See our original post on 01/04.


Divergence Software, Inc.
www.sr-analyst.com
support@sr-analyst.com
Contact Us/Subscribe

INTC - Falling into the Gap

INTC (Intel) is looking decidedly bearish on the daily. Just breaking into the gap at 42.67 that has served as support twice over the last month.

We have a series of lower-lows/lower-highs since the peak on 12/20.

If this level does not hold then next support is at 41.58.

Back on January 3 we were hoping for a bullish outcome to the consolidation.


Divergence Software, Inc.
www.sr-analyst.com
support@sr-analyst.com
Contact Us/Subscribe

GE - Bottom Bounce?

Looks like GE (General Electric) might be making a bottom bounce after a sustained downhill run.

If it can break 18.87 on volume then it will have a shot at the gap at around 20.30. However, there was a lot of volume on the most recent thrust down back in November 2017.


Divergence Software, Inc.
www.sr-analyst.com
support@sr-analyst.com
Contact Us/Subscribe

JPY - Downside Break from Consolidation

JPY (USD/Yen) showing a breakout to the downside from recent consolidation on the daily chart.

Likely to find support at 110.844. Weekly shows continuing consolidation.


Divergence Software, Inc.
www.sr-analyst.com
support@sr-analyst.com
Contact Us/Subscribe

DIS - Long term Right Triangle

DIS (Walt Disney) alerted on the weekly chart for trendline proxmity, but looks more interesting on the monthly.

Looks like a right-triangle forming so who knows which way it will break. We probably have at least 5-6 months to think about it if it continues to coil.


Divergence Software, Inc.
www.sr-analyst.com
support@sr-analyst.com
Contact Us/Subscribe

WMT - Breakout to new Highs


WMT (Walmart) on a possible breakout to new highs today.

Looks bullish on the weekly chart as well, in the form of a small pennant. Just waiting for the volume to come in and confirm.


Divergence Software, Inc.
www.sr-analyst.com
support@sr-analyst.com
Contact Us/Subscribe

D - Riding the Trend Line

D (Dominion Energy). Another Cramer honorable mention tonight after news on the Scana deal.

Not much to look at on daily or weekly but, wow,  really riding that trend line on the monthly chart.

Nothing but net since March 2009.


Divergence Software, Inc.
www.sr-analyst.com
support@sr-analyst.com
Contact Us/Subscribe

DWDP - Consolidation Breakout

Nice breakout from consolidation on DWDP (DowDupont) on the weekly chart. Cramer mention tonight won't hurt either.

Should see 79.50 soon if volume holds.


Divergence Software, Inc.
www.sr-analyst.com
support@sr-analyst.com
Contact Us/Subscribe

EUR - Cup & Handle

EUR
Looks like a small Cup & Handle pattern nearing completion on EUR (Euro) weekly chart. A breakout above the 1.2092 level on volume should get us to the 1.2350 level.

There was some minor consolidation in that area back in late 2014 when EUR was on its way down.


Divergence Software, Inc.
www.sr-analyst.com
support@sr-analyst.com
Contact Us/Subscribe

INTC - Bullish Pennant

A bullish pennant appears to be near completion on the INTC (Intel) weekly chart.

Still coiling on declining volume but if/when we get a breakout above the 48.00 level on heavy volume, we could see 56.00 or even 57.00 in a relatively short period of time. Keeping an eye on this one.


Divergence Software, Inc.
www.sr-analyst.com
support@sr-analyst.com
Contact Us/Subscribe

XOM - Inverse Head & Shoulders?

On the weekly chart we have a breakout from what sure looks like an inverse head & shoulders pattern on XOM (Exxon Mobil).

Volume is questionable since it was actually declining leading up to the breakout rather than increasing.

If this is a valid pattern we can expect to reach the 92.00 level, last seen in December 2016. If not, then price may very well bounce off of the upper trend line and continue to coil.


Divergence Software, Inc.
www.sr-analyst.com
support@sr-analyst.com
Contact Us/Subscribe

JPM - Bullish Ascending Triangle

Very bullish chart pattern in JPM (JP Morgan) today on the daily chart. Tight ascending triangle on falling volume.

If we get a breakout on volume of the 108.46 level in the next few days, we can expect to see the 115.00 level soon.


Divergence Software, Inc.
www.sr-analyst.com
support@sr-analyst.com
Contact Us/Subscribe

Latest Post

Harmonic Pattern Collection Lifetime Package

If you are currently a Harmonic Pattern Collection monthly subscriber, consider upgrading to outright purchase of the Harmonic Pat...

Most Popular