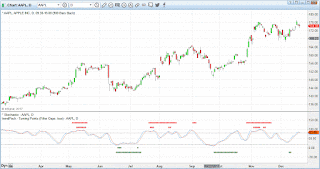
The trendPack Turning Points indicator for eSignal uses advanced cycle analysis to do just that.
When the indicator detects bearish pressure in the cycles it will begin to plot a row of red bars near the top of the chart. If this pressure increases it will begin plotting a second row of red bars just below the first. And when the indicator detects bullish pressure in the cycles it will begin to plot a row of green bars near the bottom of the chart, and if this pressure increases it will begin plotting a second row of green bars just above the first.
While no indicator can predict the future, the information that can be extracted from historical cycles (both large and small) can be very predictive. We ran some tests on very large datasets over a wide range of symbols and bar intervals, and the Turning Points indicator average accuracy rate in terms of identifying a stall and/or a change in direction was 68% for bullish pressure and 65% for bearish pressure.
Operation
Turning Points can be used standalone, or in conjunction with other indicators and/or trading systems. In a trading scenario you would typically either tighten your stop or close part of the position if bars in the opposite direction of the trade begin printing. If bars happen to print in conjunction with a trading signal (i.e., from some other indicator or system) in the same direction then this can be considered a strong confirmation of the signal.While Turning Points is designed to run in the chart area, you can also drag it into any indicators you may have loaded. Here we moved the indicator from the chart area into a Stochastics indicator pane.
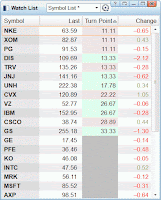
Turning Points will also operate in a watchlist. In this scenario it will color the cell background (i.e., pale green or pale red) based on the current condition, and it will plot avalue between 0 and 100 in the cell indicating the strength of the signal.
The indicator is fully automatic and will accurately identify these stall/turn areas for all securities, and under all timeframes. It does require at least 600 bars of data to perform the calculations so a eSignal Time Template is required.
As part of the installation a custom page will be created and stored in the eSignal Pages folder. The name of this page is:
trendPack - TurningPoints.page
The easiest way to get up and running is to pull up this page in eSignal right after you run the installer. The page includes a correctly-configured Time Template and, by loading the page, it will ensure that this Time Template is added to your list of available Time Templates.
Settings
Here are some of the settings available via the indicator menu:- Apply Gap Filtering Logic: check this box to pre-filter the price data to remove large opening gaps which can skew the cycle analysis
- Highlight Background: check this box to shade the background when bearish or bullish pressure is detected
- Cosmetics: various cosmetic settings are provided
- Alerts: alert options are provided
Availability
Turning Points is available in our Product catalog. Once on the Products page, scroll down until you see the available categories and select the trendPack category. If you would like to trial this indicator, just send us an email along with your eSignal program username (case-sensitive) via the support address listed below.Divergence Software, Inc.
www.sr-analyst.com
support@sr-analyst.com
Contact Us/Subscribe


No comments:
Post a Comment