eSignal Time Templates are one of the most important, yet least understood, components of the charting platform.
The vast majority of support calls/emails we receive end up being a Time Template issue. Hopefully, somewhere down the road, eSignal will provide EFS functionality that would allow us to control/modify Time Template features from within indicators and systems but, for now, it is strictly up to the end-user to configure and apply Time Templates when they are needed.
So, what is the purpose of a Time Template and why do you need to use them? Well, Time Templates perform two functions:
- They allow you to adjust the sessions (i.e., the start/end times for intraday data); and
- They allow you to set the amount of price data that will be available to indicators in your chart (or watchlist).
By default a eSignal chart will only provide around 200-250 bars of data that indicators loaded into the chart can work with. For most basic indicators this is plenty and you won't run into problems. However, when you are working with more complex indicators (i.e., like the indicators/systems we are generally working on for our clients) they can have data requirements that are much larger than 250 bars.
Also, any backtestable system will likely require thousands of bars rather than hundreds if you are hoping to get an accurate read as to the profitability of the system. And the problem gets even worse with watchlists since they only provide around 50 bars of data by default.
A good example is our marketDirection Monitor product. It scans large baskets of securities on one or more bar intervals using the eSignal watchlist component, and it is constantly looking for inflection points...areas where price is likely to make a strong move in one direction or the other. The algorithms behind this process require at least 500 bars of price data to perform the analysis and, if loaded into a chart or watchlist that does not have a Time Template applied, the system will not operate. Many of our cycle-analysis indicators require even more price data to operate (1000 to 2000 bars).
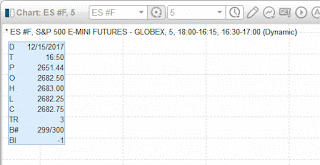
In a chart, you can determine if a Time Template is loaded by looking at the top-left section of the chart (where the symbol is displayed). If you see the word (Dynamic) in that line of text then no Time Template has been applied. If you see something other than (Dynamic), such as (900 Bars Back) or (50 Days Back) or whatever, then a Time Template has been applied, and the value displayed will give you an idea as to how much data is available.
For eSignal watchlists it is less obvious as there is no indication in the watchlist panel as to whether a Time Template has been applied or not. The only way to know for sure is to right-click in the main body of the watchlist, scroll down and highlight the Time Template option, and see if any of the Template options have been checked. If none are checked (or if Auto is checked) then no Time Template has been applied.
A good way to avoid Time Template problems is to create a default Chart and a default Watchlist, and assign a Time Template to both.
Create a Default Chart
To create a default Chart in eSignal, do the following:- Pull up a new chart in eSignal (i.e., New/Chart off of the top menu);
- Set the symbol and the bar interval to your preferred values;
- Right-click in the chart and highlight the Time Template option, a new menu will pop up to the right;
- On this new menu, click on the Edit option;
- In the Time Template dialog, click on the "plus" button that you see at top-left (i.e., Add Time Template);
- In the right-hand side of the Time Template dialog, type in a meaningful name for the template, select the Fixed option under Data Range and enter 600 and select the "Bars" option;
- Under Sessions, select the Auto option;
- Click the Close button to return to the chart;
- Right-click in the chart again, and this time highlight the Style Templates option;
- In the menu that pops up, click on the Set as Default option.
Create a Default Watchlist
To create a default Watchlist in eSignal, do the following:- Pull up a new watchlist in eSignal (i.e., New/Watchlist off of the top menu);
- Add your list of preferred symbols (optional);
- Right-click in the body of the watchlist and highlight the Time Template option, a new menu will pop up to the right;
- If you have already created a Time Template for your chart using the steps listed under Create a Default Chart above then you can simply select that Time Template from the list and skip to step #10 below. If not then continue with the steps below;
- On this new menu, click on the Edit option;
- In the Time Template dialog, click on the "plus" button that you see at top-left (i.e., Add Time Template);
- In the right-hand side of the Time Template dialog, type in a meaningful name for the template, select the Fixed option under Data Range and enter 600 and select the "Bars" option;
- Under Sessions, select the Auto option;
- Click the Close button to return to the watchlist;
- Right-click in the watchlist again, and this time highlight the Style Templates option;
- In the menu that pops up, click on the Set as Default option.
Creating both a default Chart and Watchlist only takes a couple of minutes and it will likely save you a lot of aggravation down the road.
Divergence Software, Inc.
www.sr-analyst.com
support@sr-analyst.com
Contact Us/Subscribe


No comments:
Post a Comment